FPL Season Simulation: Mini-League Predictions That Actually Work
Stop guessing where you'll finish. Our Monte Carlo simulator runs 100,000 projections to calculate your real chances of winning your mini-league.
Every FPL manager knows the feeling: you're 50 points behind your mini-league leader with 10 gameweeks left. Can you catch them? What are your actual chances? Our FPL season simulation tool answers these questions with mathematical precision, running 100,000 Monte Carlo simulations to deliver accurate mini-league projections you can trust.
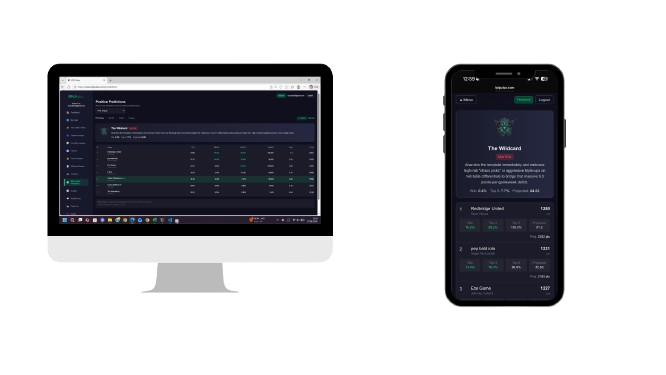
Mini-League Predictions on desktop and mobile — see your win probability, projected finish, and AI-powered strategy advice
What is FPL Season Simulation?
FPL season simulation uses statistical modeling to predict how the rest of your Fantasy Premier League season will unfold. Rather than simple averaging or gut feelings, our FPL season simulation analysis uses the same Monte Carlo methodology trusted by financial institutions and sports analytics firms worldwide.
How It Works
We analyze every manager in your mini-league, examining their historical points per gameweek, recent form trends, and scoring volatility. Then we simulate the remaining season 100,000 times, with each simulation generating realistic point totals based on each manager's unique performance profile. The result? Statistically robust probabilities for every possible finishing position.
Mini-League Projections: What You'll See
Our FPL mini league projections provide comprehensive insights into your competitive position:
Win Probability
Your percentage chance of finishing 1st in your mini-league. Based on 100,000 simulations factoring in current points, remaining gameweeks, and each competitor's scoring patterns. A 15% win probability means you won the league in 15,000 of our simulations.
Podium Probabilities (Top 3, Top 5, Top 10)
See your chances of finishing in the money positions. Even if winning seems unlikely, you might have strong top-3 or top-5 prospects. Our FPL mini-league advice adapts based on these probabilities to suggest the right risk level for your situation.
Projected Final Rank & Points
Your expected average finishing position and median projected point total. These aren't wild guesses—they're calculated from the distribution of all 100,000 simulation outcomes, giving you realistic expectations for season end.
Confidence Intervals
See the range of likely outcomes, not just single-point estimates. Our 5th-95th percentile ranges show you the realistic floor and ceiling for your final position and points. This helps you understand the uncertainty inherent in any projection.
The Science Behind Our FPL Season Simulation Analysis
What makes our FPL season simulation analysis more accurate than basic calculators?
1. We Don't Take the Table at Face Value
A naive simulator reads your points-per-gameweek straight off the table and multiplies it out. After one gameweek that means projecting a 90-point opener to 3,400 points, and handing whoever won week one a 100% chance. So instead we treat every manager's record as an estimate of their true rate, carrying an error that shrinks as gameweeks accumulate—around 18 points after one week, under 6 after ten—and weight it accordingly.
2. Past Seasons Set the Starting Point
When this season says little, your history says more. We measure how each manager finished relative to this league in their last three seasons and start them there. The weighting isn't guesswork: across 32,848 consecutive-season pairs the year-on-year carryover measures 0.37, so beating your league by 100 points last season is worth roughly 1 extra point per gameweek now. Managers new to FPL simply start at the league average with a wider spread.
3. Volatility Modeling
Two managers averaging 55 points per week might have very different outcomes. One might score 50-60 consistently, while another swings from 30 to 80. We model each manager's scoring volatility using standard deviation analysis, so boom-or-bust players are simulated realistically. On top of that, every simulation redraws how good each manager actually is—because early on, that is the larger unknown.
4. 100,000 Monte Carlo Simulations
Each simulation independently projects the remaining season for every manager using the Box-Muller transform for statistically valid random sampling. With 100,000 iterations, our probabilities converge to highly accurate estimates that simple calculators can't match.
5. Real Historical Data
We fetch actual gameweek-by-gameweek history for every manager in your league. No assumptions or generic models—your projections are based on real performance data from the official FPL API.
AI-Powered FPL Mini-League Advice
Numbers alone don't tell you what to do. Our AI advisor analyzes your simulation results and assigns you a strategic persona with personalized FPL mini-league advice:
Guardian (Win Probability >50%)
You're the favorite. Play template picks, minimize variance, and protect your lead. Don't get cute with differentials when the safe route wins.
Predator (Win Probability 15-50%)
You're in hunt mode. Introduce 1-2 calculated differentials to close the gap while maintaining a solid core. Aggressive but not reckless.
Disruptor (Top 3 >70%, Win <10%)
Podium is likely but winning needs something special. Strategic differentiation from the leader while protecting your top-3 position.
Climber (Top 3 Probability 5-25%)
You need things to break your way. Target high-ceiling picks and captain differentials. A sneaky podium finish is possible with the right moves.
Wildcard (Top 3 <5%)
Nothing to lose. Go full chaos mode with extreme differentials and punty captains. The only way to climb is to zig when everyone zags.
Why Use FPL Mini League Projections?
Make Smarter Transfer Decisions
Knowing you need to take risks changes your transfer strategy. If simulations show you need a 10-point swing to have a realistic winning chance, you might target that differential forward instead of the safe midfielder everyone owns.
Optimize Captain Picks
Leaders should captain the safe pick. Chasers might need the differential captain to close gaps. Our FPL season simulation tells you which approach fits your situation.
Time Your Chips Perfectly
Bench Boost when you need floor points to protect a lead. Triple Captain as a Hail Mary when you need ceiling. Understanding your probabilities helps time chip usage for maximum impact.
Settle Arguments with Data
"I've basically won already" vs "It's not over yet"—now you have the numbers to settle the debate. Share your simulation results and let the probabilities speak.
How to Run Your FPL Season Simulation
Step 1: Connect Your FPL Account
Link your Fantasy Premier League team ID to FPL Pulse. We'll automatically detect your mini-leagues and display them for analysis.
Step 2: Select Your Mini-League
Choose which mini-league you want to simulate. Works with classic scoring leagues up to 100 managers—perfect for work leagues, friend groups, and community competitions.
Step 3: Run the Simulation
Click "Run Predictions" and watch as we fetch historical data and execute 100,000 simulations. Results are cached for fast reloading and update automatically as new gameweeks complete.
Step 4: Get Your Strategy
Review your probabilities, check your AI persona, and adjust your FPL strategy accordingly. Share your results with rivals to add extra spice to your mini-league battles.
Share Your Mini-League Projections
Every simulation generates a shareable card showing your win probability, projected finish, AI strategy advice, and top contenders. Perfect for:
- Trash-talking rivals in your group chat
- Posting to FPL Twitter/X for community engagement
- Proving your friends wrong about their "guaranteed" win
- Celebrating when the simulations show you're the favorite
“Why is the guy in 4th the favourite?”
This is the result that makes people question the model, so it's worth walking through. Here's a real five-man league after Gameweek 1 (names changed):
| Manager | GW1 | Last 3 seasons vs league | Win % |
|---|---|---|---|
| Alex | 45 | +92, +259, +230 | 42.4% |
| Ben | 70 | +221, +139, +112 | 35.7% |
| Chris | 61 | −126, +157, −19 | 16.7% |
| Dan | 62 | −200, −399, −77 | 3.7% |
| Ellie | 36 | +15, −157, −245 | 1.4% |
Alex sits 4th and is the favourite. Ben tops the table by 8 points and is second. That looks wrong until you weigh the two pieces of evidence against each other.
Gameweek 1 is one number. Ben's 70 beats Alex's 45 by 25 points, but a single gameweek carries an error of roughly 18 points, so that gap is about as likely to be noise as signal. Over 37 remaining gameweeks it is worth almost nothing.
Three seasons is a lot of numbers. Alex has finished 92, 259 and 230 points clear of this league. Ben has too, but by a shrinking margin—221, then 139, then 112—and recent seasons count for more. That is why Alex starts fractionally ahead, and why one bad Saturday doesn't undo it.
Notice how little GW1 actually moved things: Ben's 70-point opener lifted his projection by 0.3 points per gameweek. That is the correct response to one week of data. By around GW8–10 the balance tips, this season's form outweighs the history, and a genuine hot streak will overtake a good record. And Alex being “favourite” at 42% still means he loses this league more often than he wins it—every manager here is live.
What it doesn't know
Honest limits, so you can weigh the output properly: the simulator assumes managers keep being roughly who they've been - it can't see that your rival is about to rage-quit, or that you're planning a heroic triple-differential punt. It doesn't predict specific fixtures (that's what our Predicted Points model does); it models score distributions. And probabilities refresh every gameweek as real results replace simulated ones - a 60% chance in March is a different claim than a 60% chance in May.
Free Tier & Pulse Pro
The FPL season simulation tool has a free tier — run one simulation per league per gameweek, perfect for tracking your main rivalry. Pulse Pro (£2.99/month or £24.99/year, 7-day free trial) unlocks unlimited simulations across all leagues, plus AI-tailored strategic advice, the Transfer Planner, Reddit Pulse and more.
Stop Guessing. Start Knowing.
Whether you're defending a lead or chasing a rival, our FPL mini league projections give you the data-driven insights to make smarter decisions. 100,000 simulations. Weighted form analysis. AI-powered strategy advice. All designed to help you dominate your mini-leagues.
Ready to see your true chances? Run your FPL season simulation now and discover whether you're a Guardian protecting your throne or a Wildcard with nothing to lose.
FAQs
- How does the FPL season simulation work?
- Our simulator runs 100,000 Monte Carlo simulations. For each manager it estimates a true scoring rate, then projects the remaining gameweeks from that rate with realistic week-to-week variance, and tracks where everyone finishes. The scoring rate is the important part: rather than taking this season's table at face value, we regress each manager toward what their past seasons say about them, and shift weight onto this season's form as the gameweeks accumulate.
- Why is someone in 4th place the favourite to win?
- Because a mini-league table early in the season is mostly luck, and the simulator knows it. A manager's points-per-gameweek after one week carries an error of roughly 18 points; after ten weeks it is under 6. So a 25-point lead in September is weak evidence of who is actually best, while three seasons of finishing 200 points clear of the league is strong evidence. Until this season's form is worth more than that record, the simulator will back the proven manager over the current leader. That flips around GW8-10, when your own form starts to outweigh your history.
- Do past seasons really predict the next one?
- Partly, and we measured how much rather than guessing. Across 32,848 consecutive-season pairs from a random sample of managers, the year-on-year carryover is 0.37 - stable within 0.38-0.42 in each of the last five seasons. In practice, beating your mini-league by 100 points last season projects to about 1 extra point per gameweek now. That is real signal but a long way from destiny, which is why a strong record shortens your odds without ever guaranteeing anything.
- What do the mini-league projections show?
- You'll see win probability (chance of finishing 1st), top 3/5/10 probabilities, projected final rank (average expected position), projected final points (median expected total), and confidence intervals showing the range of likely outcomes from 5th to 95th percentile.
- How accurate are the FPL mini-league predictions?
- The honest answer is that early-season probabilities are wide, and they should be. In August the confidence intervals for most managers in a league overlap almost completely, so a 40% favourite and a 17% chaser are much closer than those numbers feel. Accuracy tightens as gameweeks accumulate and simulated points get replaced by real ones. Read the confidence intervals, not just the headline percentage - if your range overlaps the leader's, the league is live.
- What does a 70% chance of winning actually mean?
- It means that in 70,000 of the 100,000 simulated seasons, you finished first. It does not mean you will win - 3 times in 10 you don't. Probabilities quantify uncertainty; they don't remove it. A 70% favourite losing is not the simulator being wrong, it's the 30% happening.
- Why do my rival and I move together in the simulations?
- Because your squads overlap. If you both own Haaland and Salah, a Haaland haul lifts you both and changes nothing between you. The simulator measures how much of each manager's starting XI is owned across the rest of the league and correlates their simulated scores accordingly - which is exactly why differentials, not template picks, are how you close a gap.
- Does the simulator account for chips?
- Yes. It reads which chips each manager has already played and credits the ones still in hand with a conservative expected bonus - a Free Hit averages around 12 extra points in the simulations, a Bench Boost around 10, a Wildcard or Triple Captain around 8, each with a realistic spread. A rival holding three chips when you have none is a real disadvantage the numbers will show.
- What is the AI strategy advisor?
- Based on your simulation results, our AI classifies you into one of five strategic personas: Guardian (protect your lead), Predator (hunt mode with differentials), Disruptor (strategic differentiation for podium), Climber (high-ceiling picks), or Wildcard (chaos picks when nothing to lose). Each persona comes with personalized tactical advice.
- Is the FPL season simulation free?
- Yes — the free tier runs one simulation per league per gameweek, which is enough to track your main rivalry. Pulse Pro unlocks unlimited simulations across all your leagues plus AI-tailored strategic advice (£2.99/month or £24.99/year, 7-day free trial).